results and discussion
- Objective: Walk your reader through your results, drawing conclusions and making interpretations as you go.
- As you go: make notes of what should go into the introduction.
structure
(key: number of suggested sentences: purpose: “example”)
- Introductory paragraph:
- 1: Review the aim of the paper: “In order to understand…”
- 3-4: Combine a methods summary (with generalized summary of results?) to call out subsections: “We used method X to quantify property Y of our study subject (section 2.1)”
- Each subsection paragraph:
- 1: Purpose of the work described in this paragraph: “In order to determine…”
- 1: Review methods or experimental design specific to this subsection (if necessary)
- 4-5: Results of that method or experiment (i.e. data features)
- 1-2: Comparison of new results against those in literature (if possible)
- 1-2: Conclusion from the combined results or some other concluding remark “Thus, analysis X revealed that…”
- 1: Interpretation of the conclusion in a larger context (if possible / reasonable)
- Let’s look at an example:
2. Results and Discussion.
In order to better understand pollution in the state of Minnesota, this study focused on a detailed analyses of chemical measurements from soil samples from 300 sites around the state. The analyses consisted of a principal components analysis to determine which sites were similar to one another (Section 2.1) followed by statistical tests to see whether differences could be detected in the sites’ chemistry (Section 2.2).
2.1 Principal Components Analysis
To understand relationships between the sites from which soil chemistry was sampled, a principal components analysis was used. Each of the 20 different analytes, all of which contained halogen atoms, were included in the analysis. A scatter plot showing the position of each of the 300 samples in a space defined by dimesions 1 and 2 (which explain 54% and 35% of the total variance of the dataset, respectively), revealed that two major clusters are present, with a small number of outliers (Fig. 1). By color coding these two clusters according to whether the samples were collected from rural versus urban areas, it was possible to see that the first cluster was made out of almost exclusively samples from urban areas, while the second cluster was made up of almost entirely samples from rural areas. This suggested that variance in pollutant chemistry among the samples collected was assocaited with urban versus rural environments.
2.2 Statistical Analyses
Using the groupings that were identified via principal components analysis, statistical tests were conducted to determine if chemical abundances differed between groups. Tests for normality and homogeneity of variance (Shapiro and Levene tests) revealed that the data could not be assessed using ANOVA but instead required the use of a non-parametric test. Accordingly, the Kruskall-Wallis test followed by post-hoc Dunn tests were applied, which showed that the abundances of halogenated pollutants is significantly higher in urban versus rural areas (p = 0.0035, Fig. 2A). These direct observations are consistent with conclusions drawn by others in recent literature reviews focused on hydrocarbon compounds (Petrucci et al., 2018; Hendrix et al., 2019). Thus, the new chemical analyses presented here demonstrate that the discrepancy in urban versus rural pollution is true not only for hydrocarbon compounds (as had been found previously), but also for halogenated compounds. Together, these findings strongly suggest that either cities are a source of more pollution or that there is some other mechanism that concentrates pollution in cities.
suggestions
Is there an efficient way to write a results and discussion section in the format outlined above? Yes. Follow the step-by-step instructions below:
outline then draft paragraphs
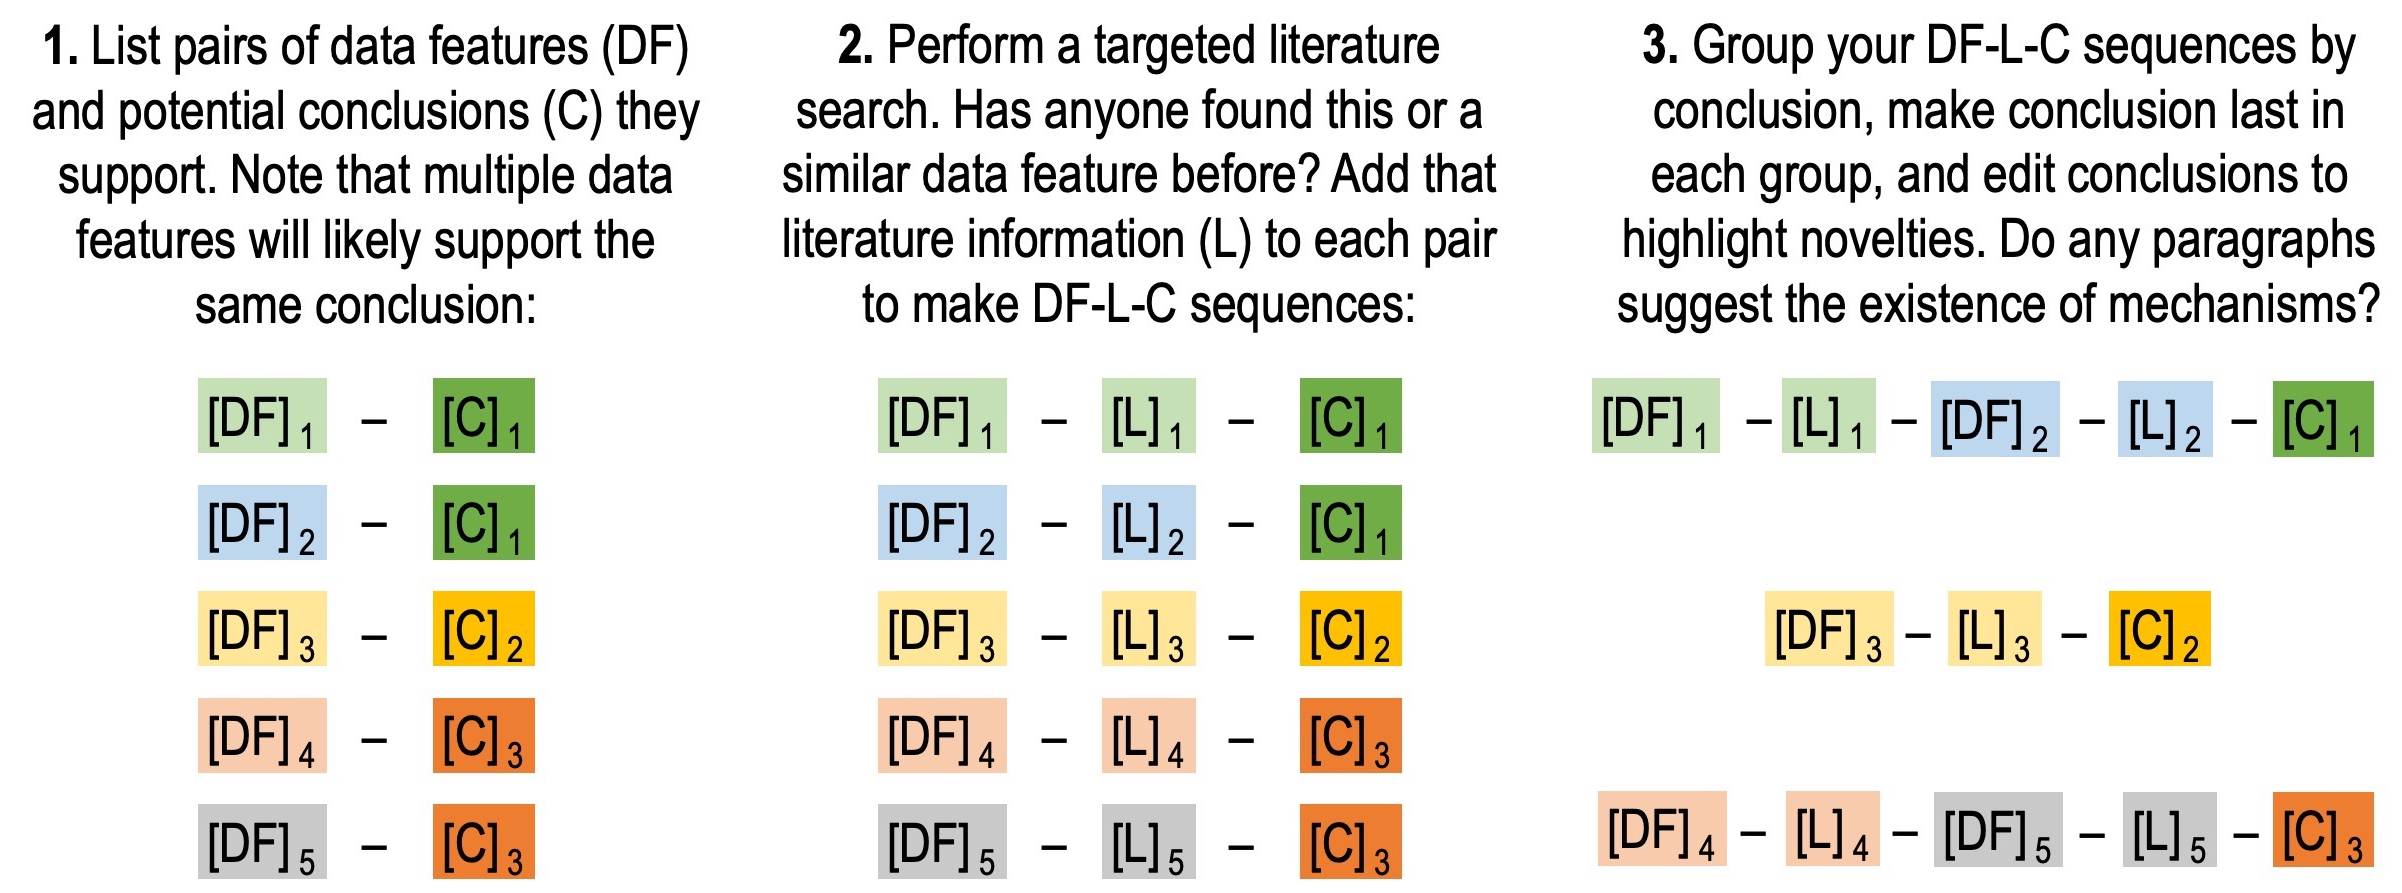
- Identify “data features” -> “conclusion” combinations. Using your figures, make a list of all the potentially interesting features in your data, then pair each feature with a possible conclusiona it could lead to. Example:
- “The GC-MS data presented here indicates that cities have higher levels of pollution than rural areas (Fig. 1),” (a data feature)
- “suggesting that either cities are a source of more pollution or that there is some other mechanism that concentrates pollution in cities.” (a conclusion)
- Perform targeted literature searches. Expand your “data feature” -> “conclusion” combinations with “supplementary information” or “literature information”. Example:
- “The GC-MS data presented here indicates that cities have higher levels of pollution than rural areas.” (data feature)
- “These direct observations are consistent with conclusions drawn by others in recent literature reviews (Petrucci., 2018; Hendrix et al., 2019)” (literature information)
- “Overall, this suggests that either cities are a source of more pollution or that there is some other mechanism that concentrates pollution in cities.” (conclusion)
- Group “data feature” -> “supp/lit info” -> “conclusion” combinations into paragraphs. Edit each conclusion so that it highlights what new contribution your data makes to the situation. Also consider whether any of the parargaphs now suggest the existence of mechanisms. Example (note the conclusion sentence in italics that highlights the new findings):
- “The GC-MS data presented here indicates that cities have higher levels of pollution than rural areas (Fig. 1). These direct observations are consistent with meta-analyses of previously published observations (Supplemental Figure 1), as well as with conclusions drawn by others in recent literature reviews (So and so et al., 2018; The other person et al., 2019). The new chemical analyses presented here thus confirm this is true for hydrocarbon compounds, and extend the observation to halogenated compounds in the atmosphere. Together these findings strongly suggest that either cities are a source of more pollution or that there is some other mechanism that concentrates pollution in cities.
order then edit paragraphs
- Identify paragraph characteristics and group
- Consider whether any of your paragraphs are prerequisites for others and whether any paragraphs can be grouped according to topic.
- Group paragraphs according to topic and prerequisite dependencies (putting prereq dependencies as close to eachother as possible.)
- Rearrange paragraph groups Create the most natural flow. Consider:
- Starting with group of paragraphs most relevant to the overall pitch/goal of the paper
- Ending on the group of paragraphs that has the most future perspective
- Ending in a strong suit (i.e. not something too speculative)
- Consider putting orphaned paragraphs (or a shortened version of them) into the conclusion section.
- Edit transitions between groups. Edit each paragraph, particularly its first and last sentences, to connect the paragraphs into a flowing document. Specifically, this means several things:
- There should be no implicit cross-paragraph references (i.e. a new paragraph should not begin “The compound described above exhibited other interesting properties”, rather, “3-hydroxycinnamic acid exhibited other interesting properties.”).
- There should be no abrupt jumps in subject between paragraphs, if there are consider breaking the discussion into subsections to help the reader identify logical resting points.
- The discussion should not require the reader to go back and read its first half in order to understand its second half.