r faq
Updating R and R Packages
Close RStudio, open the plain R GUI, then run the following:
On Mac:
install.packages('remotes') #assuming it is not remotes installed
remotes::install_github('andreacirilloac/updateR')
updateR::updateR()
On PC:
install.packages("installr")
installr::updateR()
ordering
A list of numeric element has an inherent order to it: -inf -> +inf. A list of character element also has an inherent order to it: A -> Z, or if it’s a mixed number and letter list (which is interpreted by R as a character list): 0 -> 9 -> A -> Z.
However, there are cases where we will want a list of character elements to have some order other than A -> Z. In these cases, we want to convert the list of character elements into a list of factor elements. Factors are lists of character elements that have an inherent order that is not A -> Z. For example, in the plot below, the y axis is not, perhaps, in the “correct” order:
ggplot(periodic_table) +
  geom_point(aes(y = group_number, x = atomic_mass_rounded))
How do we fix this? We need to convert the column group_number into a list of factors that have the correct order (see below). For this, we will use the command factor, which will accept an argument called levels in which we can define the order the the characters should be in:
periodic_table$group_number <- factor(
  periodic_table$group_number,
  levels = c("1", "2", "3", "4", "5", "6", "7", "8", "9", "10", "11", "12", "13", "14", "15", "16", "17", "18", "lanthanides", "actinides")
)

periodic_table
## # A tibble: 118 × 41
##    atomic_number element_name atomic_symbol group_number
##            <dbl> <chr>        <chr>         <fct>
##  1             1 hydrogen     H             1
##  2             2 helium       He            18
##  3             3 lithium      Li            1
##  4             4 beryllium    Be            2
##  5             5 boron        B             13
##  6             6 carbon       C             14
##  7             7 nitrogen     N             15
##  8             8 oxygen       O             16
##  9             9 fluorine     F             17
## 10            10 neon         Ne            18
## # ℹ 108 more rows
## # ℹ 37 more variables: period <dbl>,
## #   atomic_mass_rounded <dbl>, melting_point_C <dbl>,
## #   boiling_point_C <dbl>, state_at_RT <chr>,
## #   density_g_per_mL <dbl>,
## #   electronegativity_pauling <dbl>,
## #   first_ionization_poten_eV <dbl>, …
Notice that now when we look at the type of data that is contained in the column group_number it says “
ggplot(periodic_table) +
  geom_point(aes(y = group_number, x = atomic_mass_rounded))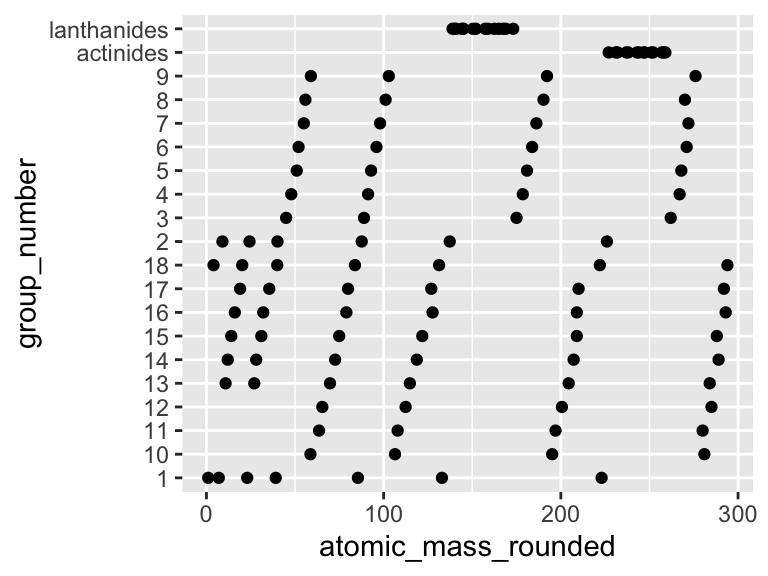
VICTORY!
column manipulation
How to select specific columns:
alaska_lake_data %>%
  select(water_temp, pH)
## # A tibble: 220 × 2
##    water_temp    pH
##         <dbl> <dbl>
##  1       6.46  7.69
##  2       6.46  7.69
##  3       6.46  7.69
##  4       6.46  7.69
##  5       6.46  7.69
##  6       6.46  7.69
##  7       6.46  7.69
##  8       6.46  7.69
##  9       6.46  7.69
## 10       6.46  7.69
## # ℹ 210 more rows
How to remove certain columns:
alaska_lake_data %>%
  select(!water_temp)
## # A tibble: 220 × 6
##    lake            park     pH element mg_per_L element_type
##    <chr>           <chr> <dbl> <chr>      <dbl> <chr>
##  1 Devil_Mountain… BELA   7.69 C          3.4   bound
##  2 Devil_Mountain… BELA   7.69 N          0.028 bound
##  3 Devil_Mountain… BELA   7.69 P          0     bound
##  4 Devil_Mountain… BELA   7.69 Cl        10.4   free
##  5 Devil_Mountain… BELA   7.69 S          0.62  free
##  6 Devil_Mountain… BELA   7.69 F          0.04  free
##  7 Devil_Mountain… BELA   7.69 Br         0.02  free
##  8 Devil_Mountain… BELA   7.69 Na         8.92  free
##  9 Devil_Mountain… BELA   7.69 K          1.2   free
## 10 Devil_Mountain… BELA   7.69 Ca         5.73  free
## # ℹ 210 more rows
user color palettes
Suppose we want to create a specific color palette for each pack in alaska_lake_data. There are three unique parks:
unique(alaska_lake_data$park)
## [1] "BELA" "GAAR" "NOAT"
First we define the colors we want:
custom_colors_for_lakes <- c("#1a9850", "#ffffbf", "#d73027")
custom_colors_for_lakes
## [1] "#1a9850" "#ffffbf" "#d73027"
Then we name that vector according to which park we want to be which color:
names(custom_colors_for_lakes) <- c("GAAR", "NOAT", "BELA")
custom_colors_for_lakes
## GAAR NOAT BELA
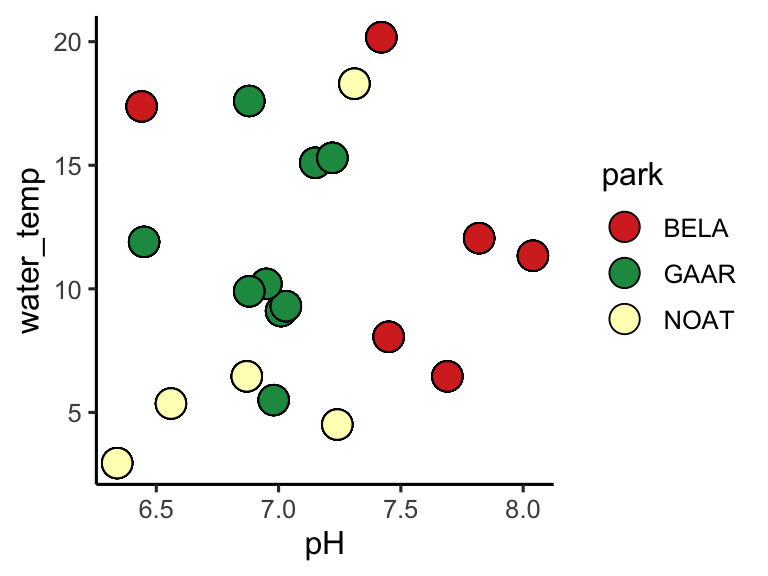
## "#1a9850" "#ffffbf" "#d73027"Now we feed that object to the values argument of scale_color_manual (or scale_fill_manual, if you want fill):
ggplot(alaska_lake_data) +
  geom_point(aes(x = pH, y = water_temp, fill = park), size = 5, shape = 21, color = "black") +
  scale_fill_manual(values = custom_colors_for_lakes) +
  theme_classic()