overview
In bioanalytical science, we separate, identify, and quantify matter - be it DNA, RNA, proteins, small molecules, or even atoms. To connect our data with the world around us and answer scientific questions, multiple chemical entities must be separated, quantified, and identified. As our ability to collect analytical data expands, so must our ability to effectively analyze that data - whether its 10 data points or 10,000.
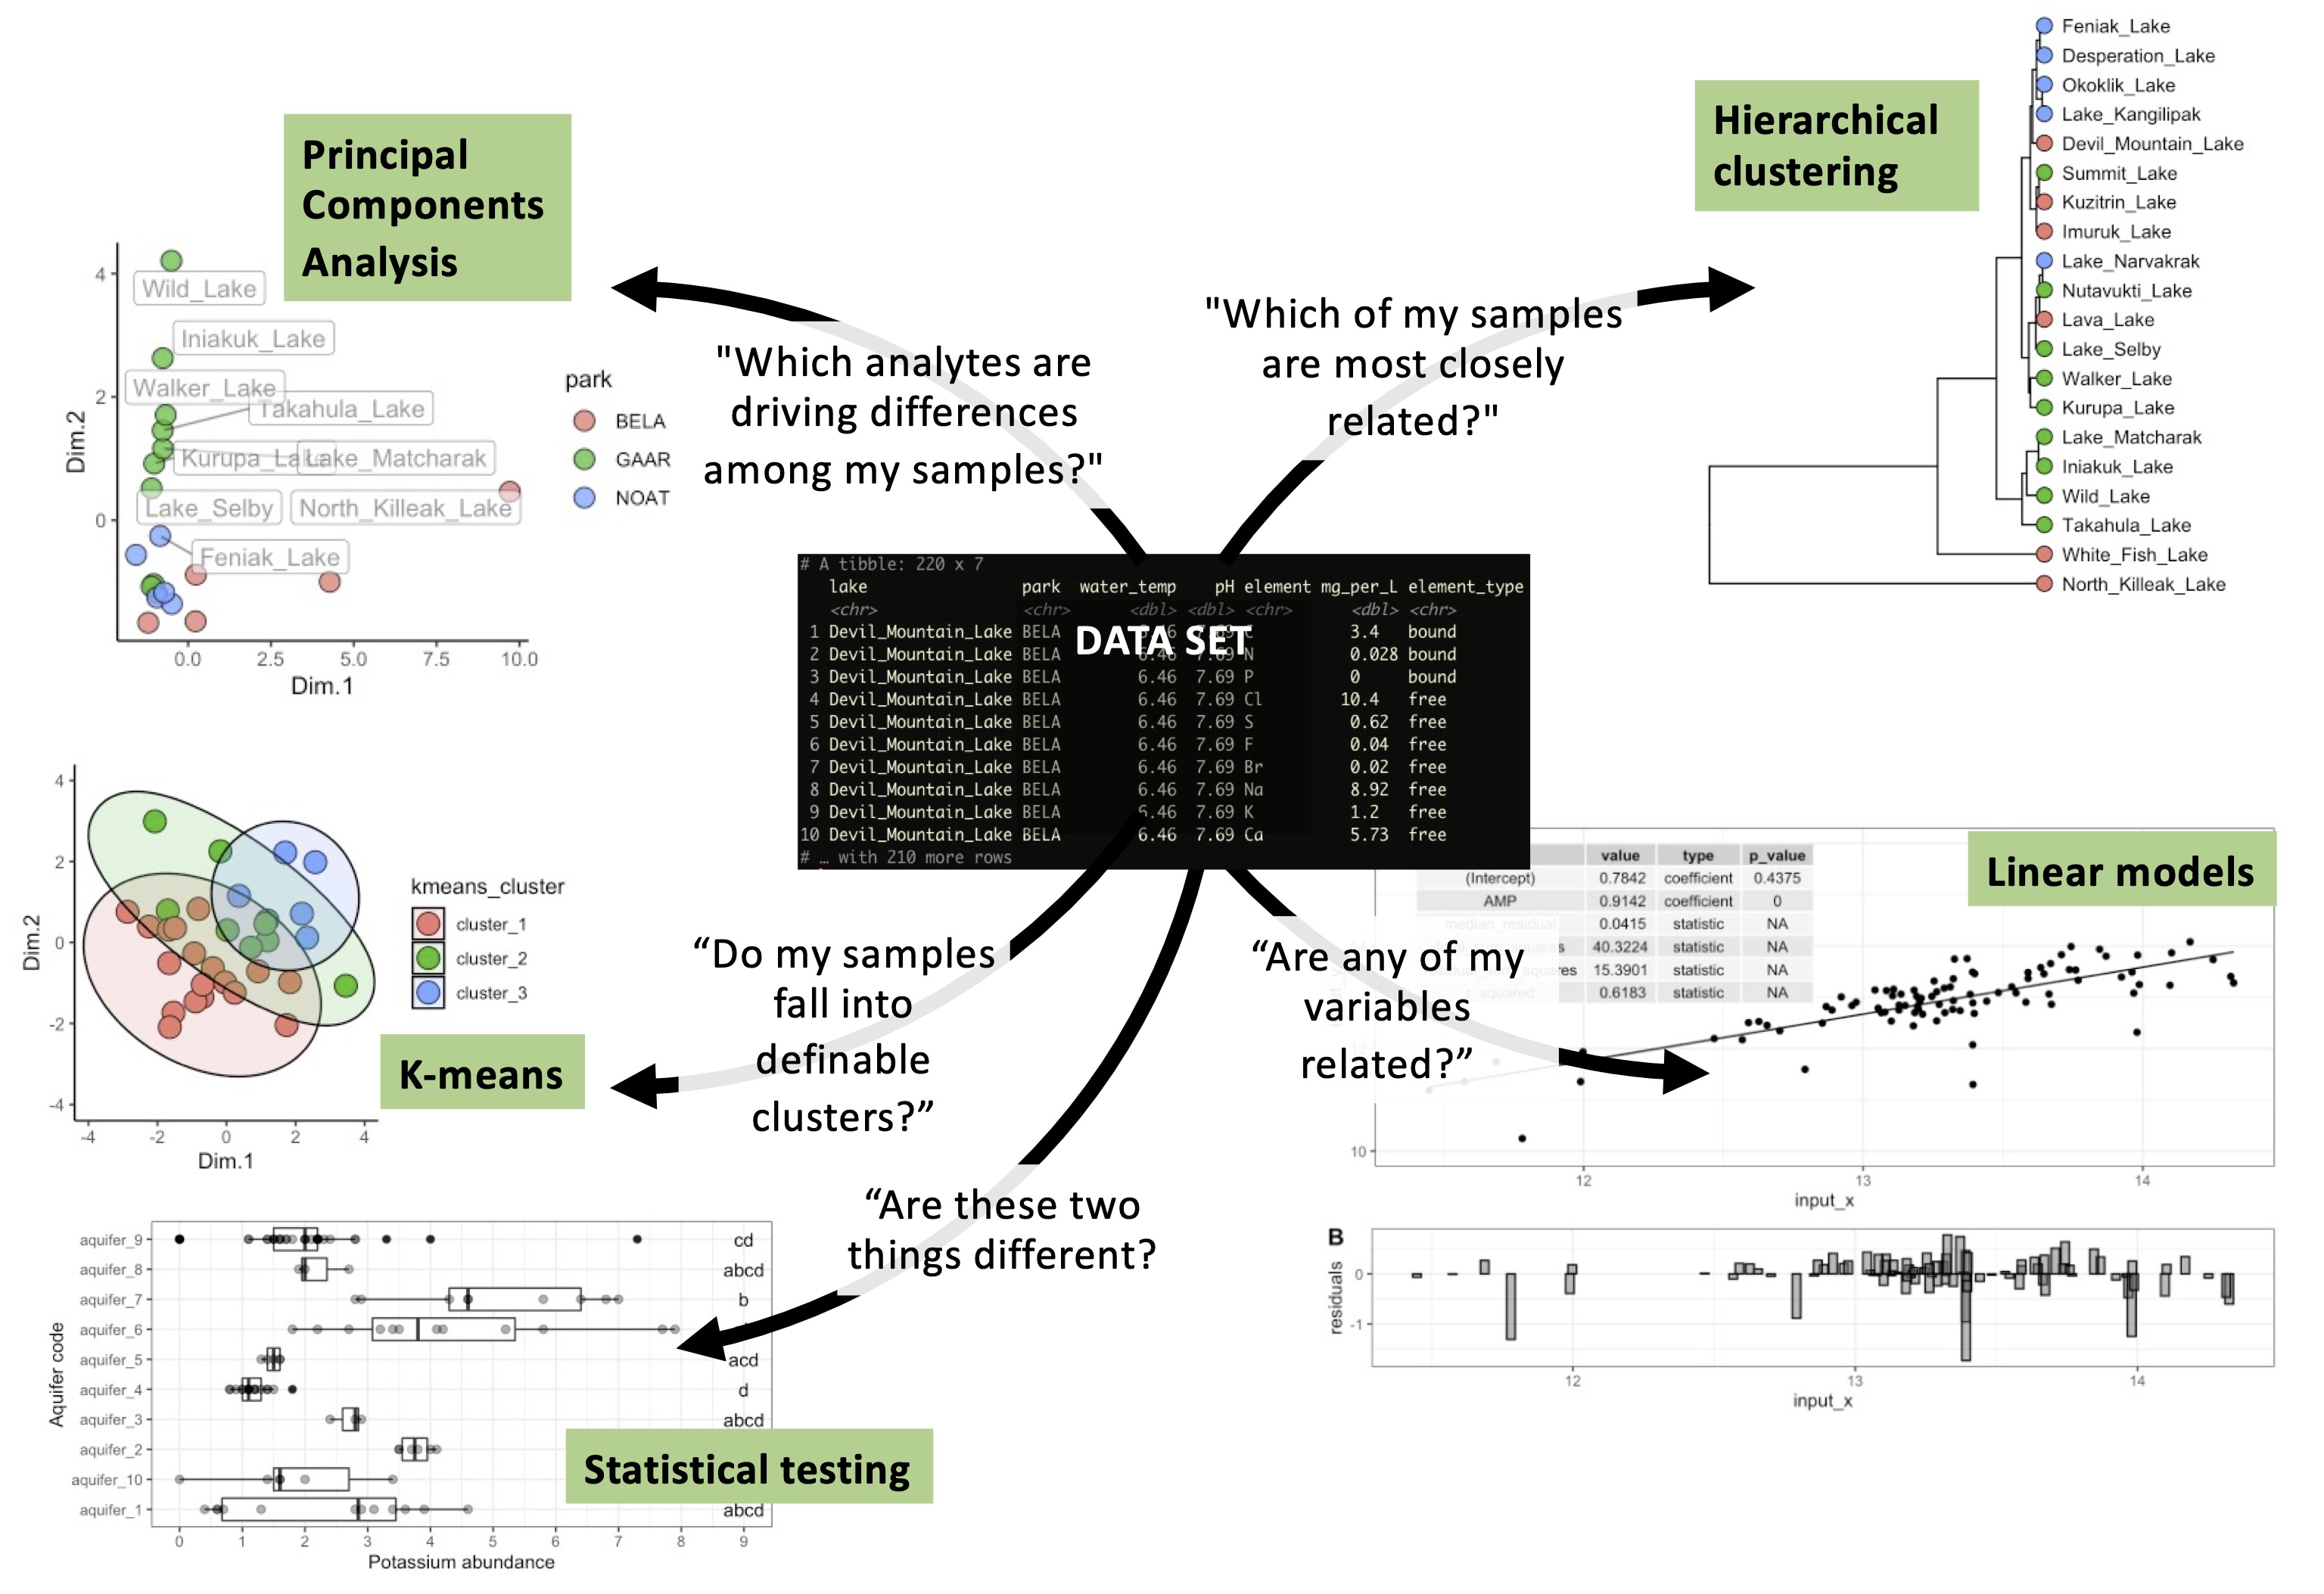
This book first covers data analysis in R. We will first look at tools for hypothesis generation, including: (i) encoding variables in visual representations of data and (ii) summarizing and providing overviews of large data set. We will then turn to evaluating hypothesese with data by looking at statistical tests and models. Finally, we will look at how to communicate our results in a clear and effective way. These techniques will also allow us to answer common quesions we may have about our data: “Which of my samples are most closely related?”, “Which analytes are driving differences among my samples?”, “Do my samples fall into definable clusters?”, “Are any of my variables related?”, and “Are any of these distributions different?”.
Let’s get started!