Course Overview

In the natural sciences, accurate data analysis, visualization, statistical treatment, and communication are imperative. This course emphasizes the importance of efficiently analyzing increasing volumes of data and articulating findings clearly. Utilizing R for data analysis, participants will gain proficiency in tools for hypothesis generation, including visual data representation and summarizing large datasets. The course also explores statistical tests and models for hypothesis evaluation, equipping students to address specific analytical questions. Effective communication strategies for results are also covered, supporting clarity in conveying complex scientific data.

Course Details

  • Credits: 3
  • Meets: MWF 8:00-8:50 AM
  • Instructor: Lucas Busta
  • Email: bust0037@umn.edu

Learning Outcomes

  • Import, organize, and transform natural sciences datasets
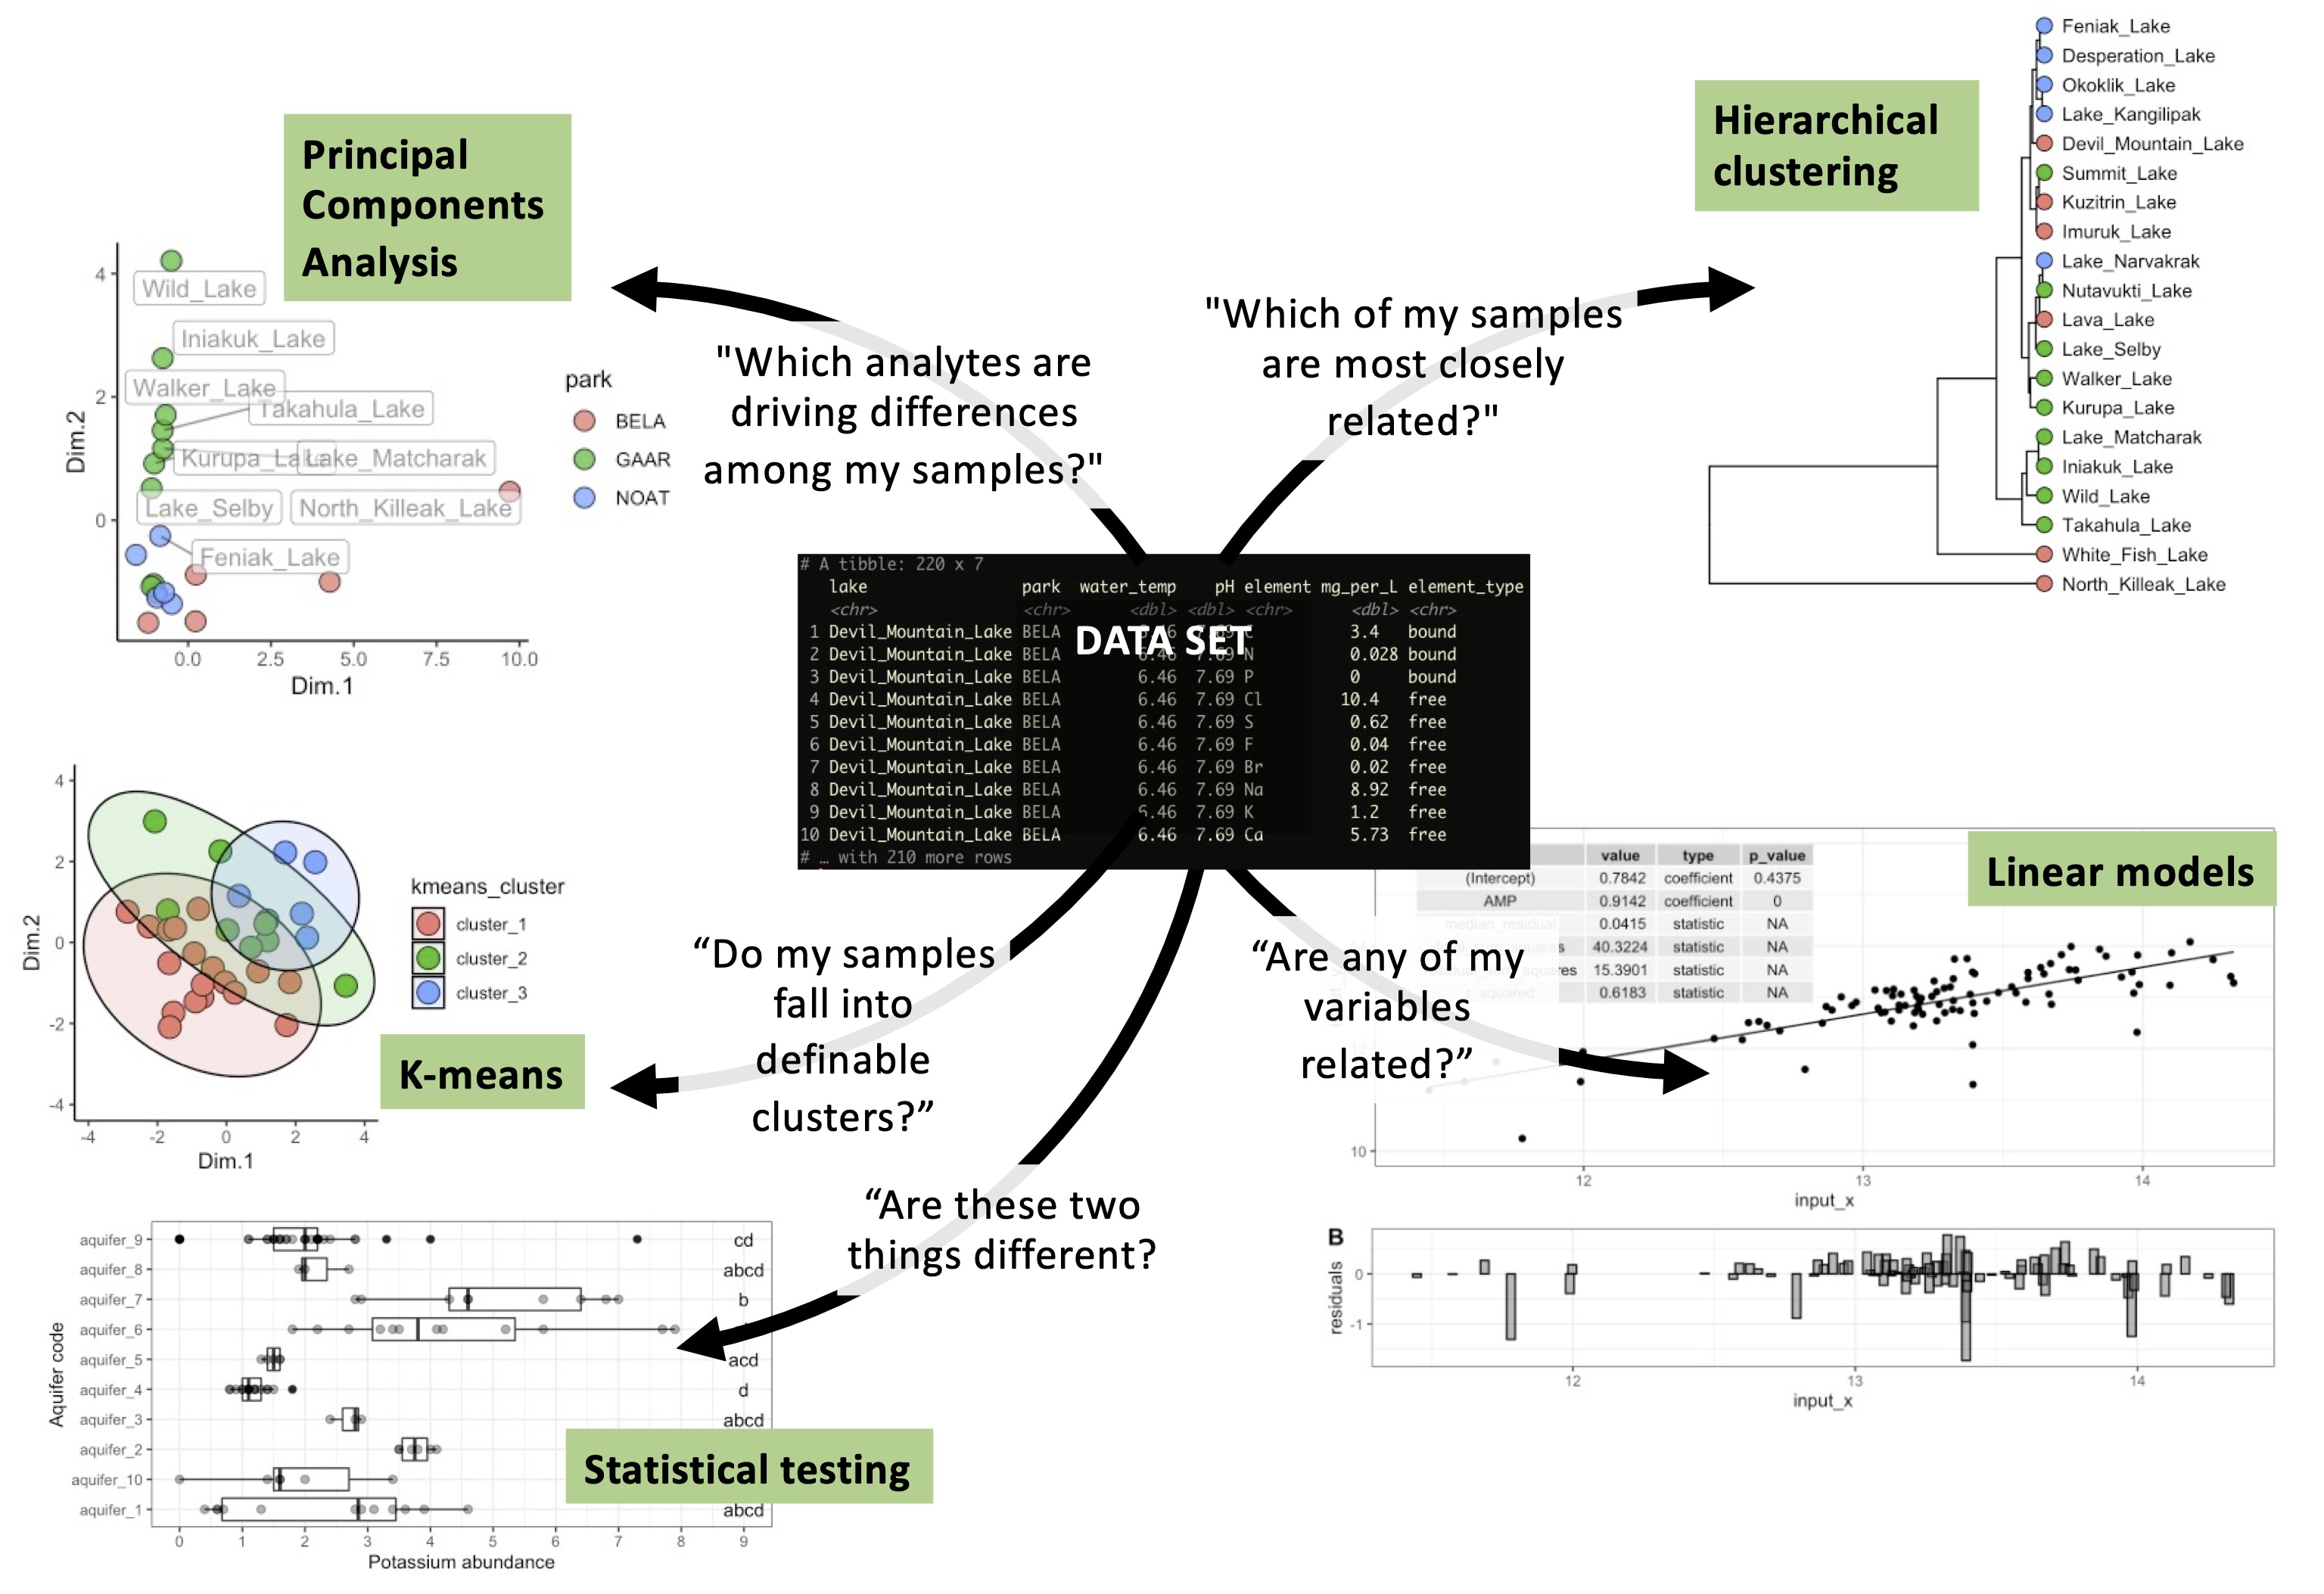
  • Generate hypotheses by identifying trends using summary statistics, PCA, and clustering
  • Statistically evaluate hypotheses using ANOVA, regression, and machine learning models
  • Present findings in visual, written, and oral formats
  • Provide professional peer critique of technical work

what we cover

Course Modules

module 1

Getting Started

Set up your R environment and get oriented with the course tools and workflow. We survey the landscape of bioanalytical data analysis before diving in.

  • Overview of bioanalytical data analysis
  • R and RStudio installation

module 2

Data Visualization

Learn to encode variables visually and build intuitive, interpretable representations of complex datasets. We explore the principles of good visualization and common pitfalls.

  • Data visualization I: fundamentals
  • Data visualization II: advanced encodings
  • Data visualization III: communication

module 3

Statistical Methods

Transform and summarize large datasets, find patterns through clustering and dimensionality reduction, and test hypotheses using parametric and non-parametric approaches.

  • Data wrangling and summaries
  • Hierarchical clustering
  • Dimensional reduction (PCA)
  • Flat clustering (k-means)
  • Comparing means (ANOVA, Tukey, Kruskal)

module 4

Models

Quantify relationships and classify unknowns using regression and machine learning. Learn to evaluate model performance and interpret results in a scientific context.

  • Model use
  • Single linear regression
  • Multiple linear regression
  • Assessing regression models
  • Random forests

module 5

Sequence Analysis

Extend data analysis skills to biological sequences. Analyze homology, build alignments, and construct and interpret phylogenies from DNA and protein data.

  • Homology and sequence databases
  • Sequence alignments
  • Phylogeny construction
  • Phylogenetic analysis

module 6

Language Models

Learn how language models transform text into numbers and generate new text. We use these tools to analyze scientific literature and produce automated text outputs.

  • Text embeddings (GloVe, transformers)
  • Embedding-based literature analysis
  • Generative text models

module 7

Protein Language Models

Apply the concepts of language modeling to protein sequences. We explore how protein language models learn biochemical grammar from sequence data and predict structure and function.

  • Protein sequence embeddings
  • ESM and related models
  • Structure and function prediction

capstone

Final Project

Each student selects a large dataset and applies course techniques to produce a scientific mini-manuscript, complete with abstract, introduction, results, discussion, and conclusion. A mid-semester Data Update presentation and a peer review of a classmate's work round out the experience.