18 faq
18.1 filtering
filter(<data>, <variable> < 18) ## less than 18
filter(<data>, <variable> <= 18) ## less than or equal to 18
filter(<data>, <variable> > 18) ## greater than 18
filter(<data>, <variable> >= 18) ## greater than or equal to 18
filter(<data>, <variable> == 18) ## equals than 18
filter(<data>, <variable> != 18) ## not equal to 18
filter(<data>, <variable> == 18 | <variable> == 19) ## equal to 18 or 19
18.2 ordering
A list of numeric element has an inherent order to it: -inf -> +inf. A list of character element also has an inherent order to it: A -> Z, or if it’s a mixed number and letter list (which is interpreted by R as a character list): 0 -> 9 -> A -> Z.
However, there are cases where we will want a list of character elements to have some order other than A -> Z. In these cases, we want to convert the list of character elements into a list of factor elements. Factors are lists of character elements that have an inherent order that is not A -> Z. For example, in the plot below, the y axis is not, perhaps, in the “correct” order:
ggplot(periodic_table) +
  geom_point(aes(y = group_number, x = atomic_mass_rounded))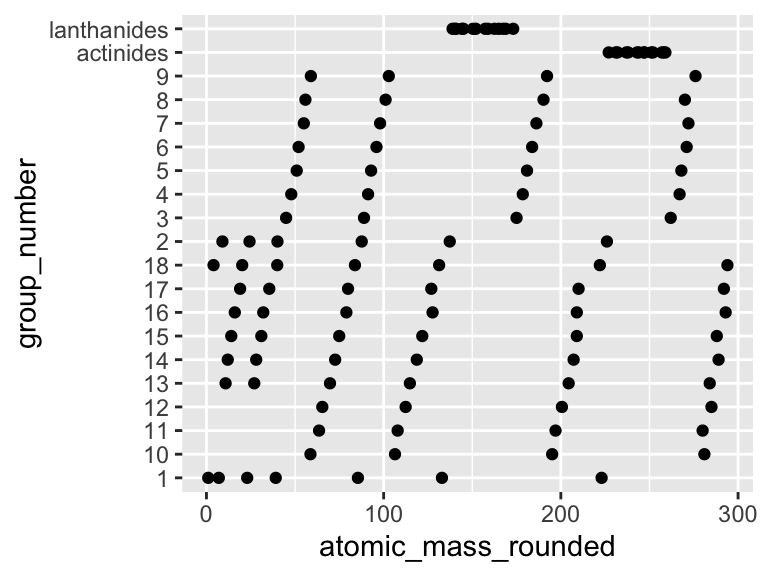
How do we fix this? We need to convert the column group_number into a list of factors that have the correct order (see below). For this, we will use the command factor, which will accept an argument called levels in which we can define the order the the characters should be in:
periodic_table$group_number <- factor(
  periodic_table$group_number,
  levels = c("1", "2", "3", "4", "5", "6", "7", "8", "9", "10", "11", "12", "13", "14", "15", "16", "17", "18", "lanthanides", "actinides")
)

periodic_table
## # A tibble: 118 × 41
##    atomic_number element_name atomic_symbol group_number period atomic_mass_rou…
##            <dbl> <chr>        <chr>         <fct>         <dbl>            <dbl>
##  1             1 hydrogen     H             1                 1             1.01
##  2             2 helium       He            18                1             4.00
##  3             3 lithium      Li            1                 2             6.97
##  4             4 beryllium    Be            2                 2             9.01
##  5             5 boron        B             13                2            10.8
##  6             6 carbon       C             14                2            12.0
##  7             7 nitrogen     N             15                2            14.0
##  8             8 oxygen       O             16                2            16
##  9             9 fluorine     F             17                2            19
## 10            10 neon         Ne            18                2            20.2
## # … with 108 more rows, and 35 more variables: melting_point_C <dbl>,
## #   boiling_point_C <dbl>, state_at_RT <chr>, density_g_per_mL <dbl>,
## #   electronegativity_pauling <dbl>, first_ionization_poten_eV <dbl>,
## #   second_ionization_poten_eV <dbl>, third_ionization_poten_eV <dbl>,
## #   electron_affinity_eV <dbl>, atomic_radius_ang <dbl>,
## #   ionic_radius_ang <dbl>, covalent_radius_ang <dbl>,
## #   atomic_volume_cm3_per_mol <dbl>, crystal_structure <chr>, …
Notice that now when we look at the type of data that is contained in the column group_number it says “
ggplot(periodic_table) +
  geom_point(aes(y = group_number, x = atomic_mass_rounded))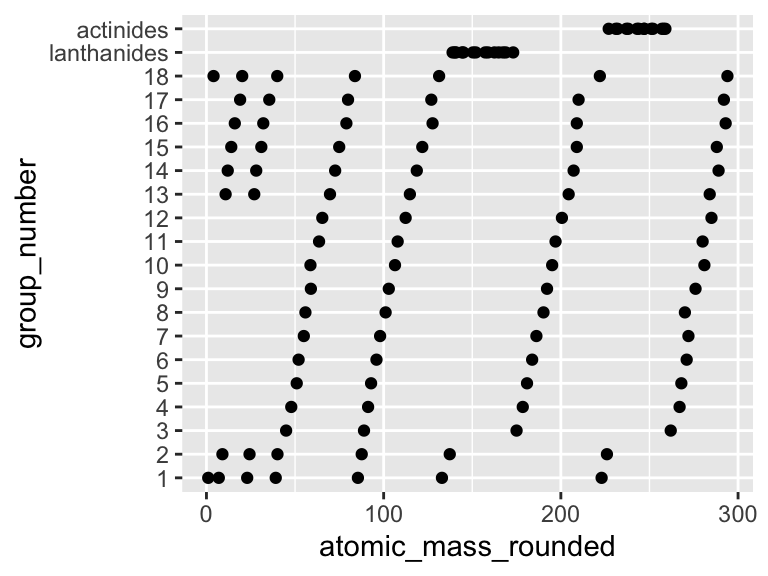
VICTORY!
18.3 column manipulation
How to select specific columns:
alaska_lake_data %>%
  select(water_temp, pH)
## # A tibble: 220 × 2
##    water_temp    pH
##         <dbl> <dbl>
##  1       6.46  7.69
##  2       6.46  7.69
##  3       6.46  7.69
##  4       6.46  7.69
##  5       6.46  7.69
##  6       6.46  7.69
##  7       6.46  7.69
##  8       6.46  7.69
##  9       6.46  7.69
## 10       6.46  7.69
## # … with 210 more rows
How to remove certain columns:
alaska_lake_data %>%
  select(!water_temp)
## # A tibble: 220 × 6
##    lake                park     pH element mg_per_L element_type
##    <chr>               <chr> <dbl> <chr>      <dbl> <chr>
##  1 Devil_Mountain_Lake BELA   7.69 C          3.4   bound
##  2 Devil_Mountain_Lake BELA   7.69 N          0.028 bound
##  3 Devil_Mountain_Lake BELA   7.69 P          0     bound
##  4 Devil_Mountain_Lake BELA   7.69 Cl        10.4   free
##  5 Devil_Mountain_Lake BELA   7.69 S          0.62  free
##  6 Devil_Mountain_Lake BELA   7.69 F          0.04  free
##  7 Devil_Mountain_Lake BELA   7.69 Br         0.02  free
##  8 Devil_Mountain_Lake BELA   7.69 Na         8.92  free
##  9 Devil_Mountain_Lake BELA   7.69 K          1.2   free
## 10 Devil_Mountain_Lake BELA   7.69 Ca         5.73  free
## # … with 210 more rows